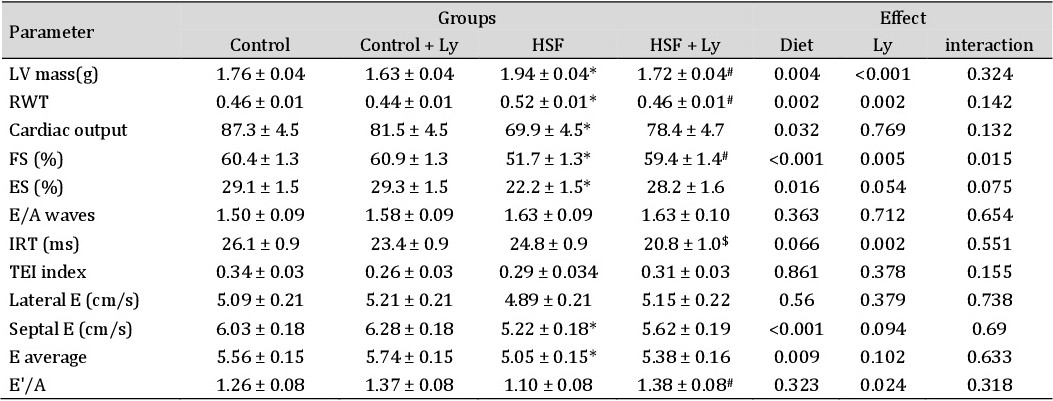
Table 1. Echocardiographic evaluation. Data are expressed in mean ± standard deviation (n= 8 animals/group). LV: left ventricle; RWT: Relative wall thickness; FS: Fraction shortening; ES: Endocardial shortening; E/A waves: diastolic mitral inflow velocity ratio; IRT: Isovolumetric relaxation time. TEI: Myocardial Performance Index; Lateral E: mitral tissue Doppler velocity lateral; Septal E mitral tissue Doppler velocity septal; Average E: mitral tissue Doppler velocity (medium of lateral and septal velocities); E´/A: diastolic mitral inflow doppler velocity ratio. Comparison by Two-way ANOVA with Tukey post-hoc (p < 0.05). *HSF vs Control; # HSF vs HSF + Ly; $HSF + Ly vs Control + Ly